A VISUAL ANALYSIS OF MOTIVATION, CAUSE, AND ROUTES
SEPTEMBER 24, 2022

VISUALIZING MIGRATION PATTERNS
Migration in West Africa has been taking place for centuries for different reasons. Many dimensions of migration remain insufficiently documented and poorly understood. In particular, factors of migration in destination areas and areas of origin are still lacking comprehensive analysis. In this paper, we bring a new perspective to the model of push and pull factors of migration in West Africa by reviewing and analyzing interview-based case studies of migration related to Ghana, Burkina Faso, and Nigeria, as well as to the associated migration routes. The overall aim of this study was to determine the areas that individuals historically chose as destinations for migration and what they perceived to be the distinctive conditions in those areas. Hence, characteristic features about destination areas and areas of origin were identified and located in maps, whereas interrelationships among push and pull factors were illustrated by means of Sankey diagrams. With these tools, we provide a novel combination for visualizing the reasons for migration.
The literature review emphasizes the complex relationships between different drivers of migration, with environmental and economic factors emerging as the most important drivers of migration in the focus countries. Moreover, the identified and mapped migration patterns suggest that individuals migrate mainly from the northern part of a particular country to its center or southern regions. This scientific approach shows that the spatial allocation of migratory movements can facilitate assessments on how to meet specific Sustainable Development Goals and to improve regional policies.
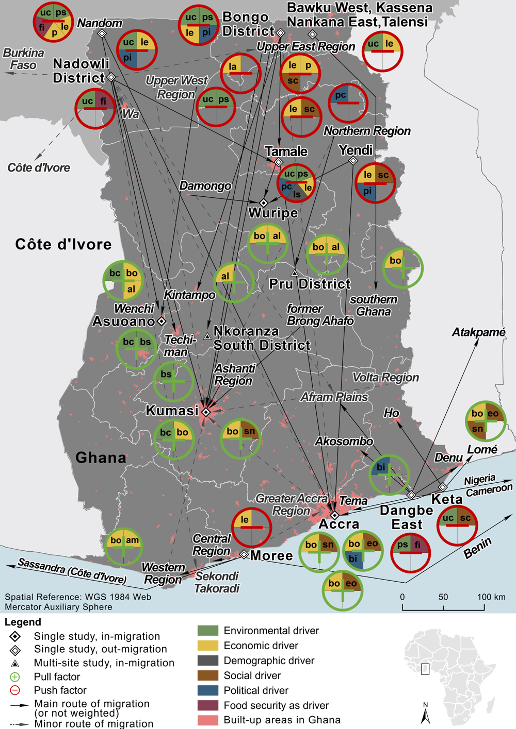
Figure 1: Migration flows and drivers in Ghana with allocated push and pull factors; author illustration based on literature review. Source of built-up area: CIESIN et al. 2020b. Explanation of codes: push factors (red circles): fi = food insecurity, la = lack of available land, le = lack of economic opportunities, ls = land scarcity, p = poverty, pc = political conflicts, pi = poor infrastructure, ps = poor soil or land degradation, sc = social conflicts, uc = unfavorable climatic conditions; pull factors (green circles): al = available land, am = access to market, bc = better climatic conditions, bi = better infrastructure, bo = increase of income or better opportunities, bs = better soils or fertile land, eo = education opportunities, sn = social network
The objectives in this paper are as follows:
- to ascertain and spatially allocate reasons for migration by analyzing survey-based case studies in the context of the previously described six drivers;
- to characterize destination areas and areas of origin by assigning respective push and pull factors in order to supplement the traditional push–pull model;
- to locate migration routes based on the conducted literature review; and
- to visualize the outcomes of the aforementioned objectives for a better understanding of migration patterns in the West African countries Ghana, Burkina Faso, and Nigeria

The evaluation of 26 case studies confirmed that environmental and economic drivers were the main forces affecting migration in the focus countries Ghana, Burkina Faso, and Nigeria. Although environmental factors were among the most frequently cited reasons for outmigration, economic factors appeared to be the most powerful factor attracting people to particular regions. Our visual analysis demonstrates that push and pull factors of the relevant drivers are closely interrelated, but that the counterpart of a push factor is not necessarily identified as the pull factor. The compilation of available information underlines the assumption that the decision to migrate depends on the coincidence of several unfavorable factors, based on the fact that in about 75% of the cases more than one push factor was mentioned. By means of the push–pull model, it was possible to spatially allocate and characterize destination areas and areas of origin with factors influencing migration and to illustrate these results in overview maps. In addition, Sankey diagrams appeared to be a useful tool to emphasize the outcomes of the overview maps, in particular with regard to disproving the assumption that a destination area is characterized by the very factors that are not present in the area of origin.
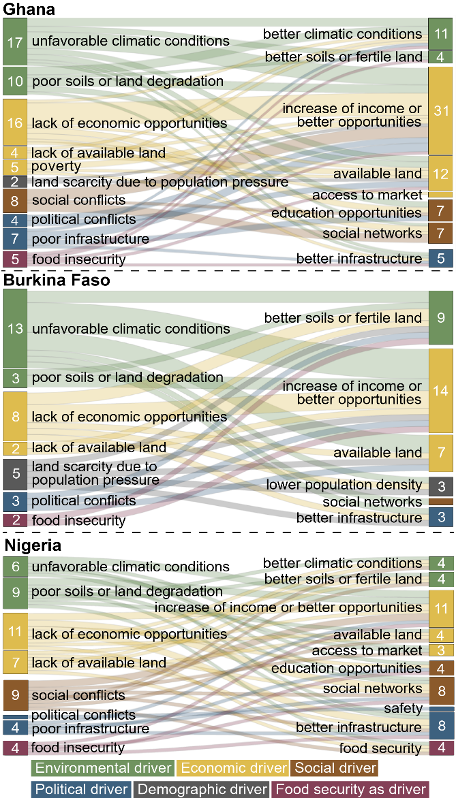
Figure 2: Sankey diagram showing the interconnections of push and pull factors for Ghana, Burkina Faso and Nigeria. Numbers in the left-sided boxes reflect how many pull factors are named in the context of the respective push factors. Numbers on the right-hand side reflect the number of push factors that are named in the context of the respective pull factors. Colors of the boxes show the same driver categories. Colors of the lines reflect the category of push factors.
This approach resulted in a novel enhancement of the classical push–pull model that can be easily adapted to other study areas. By identifying factors that motivate people to migrate and allocate them to locations where out- or in-migration took place, policy and decision makers can use these insights for the compliance and achievement of certain SDGs or the targeted registration of land.
The full paper can be found here